Table of contents
Given its growing population and above world-average GDP growth, the ASEAN-5 have closed down a remarkable year, proving an overall positive outcome for Southeast Asia economic outlook. For example, economy in the Philippines now grows faster than in China.
Read this blog post for an overview of the Southeast Asia economic outlook and use variety of our graphs to illustrate your presentations about investing in Southeast Asia.
#1 ASEAN Total GDP vs Global GDP
When taking ASEAN as a single unit, it represents one powerful resource – the third largest market and one of the largest economies. Furthermore, as per OECD, ASEAN’s real GDP is growing at 5.1%. Also comparing this with Latin America, where the economies are arising from a two-year recession with modest GDP growth between 1.5% to 2%.
While Q2 2017 saw global real GDP increase by 3.7% year on year. The quarterly growth unseen since 2014. In addition, OECD has shared their projections for world’s real GDP growth in November with the general assessment of the macroeconomic situation. The economy is growing at its fastest pace. The global GDP growth is expected to be over 3½ % in 2017. The projections go further as far as showing a 3¾ % in 2018, easing slightly in 2019.
Increasing Production in Southeast Asia
While based on McKinsey, there are three global trends worth capitalizing for Southeast Asia. Once doing so, an increase in productivity and billions in economic value will follow by 2030:
- Capturing a greater share of global trade flows – For instance, to attract more global production, Southeast Asia needs a rise in labour productivity.
- Riding the urbanization wave – By 2030, over 90 million people are expected to move to urban areas. It will be supporting the continuous increase of consuming class, which by the time could double to the amount of 263 million households. Keeping up with these adjustments would require an estimated $US 7 trillion investment on infrastructure, housing and commercial space.
- Deploying disruptive technologies – Mobile Internet, big data, Internet of things, cloud and automation of knowledge work are five technologies listed as major improvements in modernizing sectors and driving productivity across Southeast Asia.
According to McKinsey, these technologies may produce US$ 220 billion to US$ 625 billion in annual economic impact by 2030. This is when the public and private sectors build out necessary Internet backbone infrastructure and also address workforce skills.
#2 Annual Real GDP Growth
While citing a comment from ADB by Yasuyuki Sawada, Asian Development Bank’s Chief Economist:
“Developing Asia continues to drive the global economy even as the region adjusts to a more consumption-driven economy in the People’s Republic of China (PRC) and looming global risks. While uncertain policy changes in advanced economies do pose a risk to the outlook, we feel that most economies are well positioned to weather potential short-term shocks.”
|
Country |
Estimates and latest projections Year-over-year change / % |
||
|
2016 |
2017 |
2018 |
|
|
Vietnam |
6.2 |
6.3 | 6.3 |
| Philippines |
6.9 |
6.6 |
6.7 |
| Indonesia |
5.0 |
5.2 |
5.3 |
|
Malaysia |
4.2 | 5.4 |
4.8 |
| Myanmar |
6.1 |
7.2 |
7.6 |
| Thailand |
3.2 |
3.7 |
3.5 |
| Singapore | 2.0 | 2.5 |
2.6 |
Source: International Monetary Fund
![]()
Source: www.google.com/publicdata from World Bank
Indonesia GDP Growth
As per the Asian Development Bank, a major asset leading Indonesia into this GDP growth was strengthening both:
- Investments
- Exports
In addition, the Indonesia Economic Outlook from Focus Economics shows that retail sales picked up in October, simultaneously with export growth. However, November caught the attention for rising consumer confidence and manufacturing PMI. Furthermore, the government is also planning an increase in tax revenues and thus has been amending contracts with several largest mining companies operating in Indonesia.
Vietnam GDP Growth
Key factors behind Vietnam’s economic outlook was growing exports, rising 20% year on year in August and September 2017. Though most significant economic changes seen in Vietnam throughout the year taken from Bloomberg:
- Manufacturing – 12.8% rise through September from a year earlier
- Exports -19.8% increase with a trade deficit $US 442.00 million at the time
- Disbursed Foreign Direct Investment – Rising 13.4% up to $US 12.5 billion. Leading to pledged foreign direct investment increasing to 34.3%
- Consumer prices – Rising 3.4% in September compared to year earlier
The Philippines GDP Growth
Looking at the Philippines, the third quarter of 2017 showed an excellent 6.9% GDP growth. According to the Philippine Statistics Authority, the main drivers were:
- Manufacturing
- Trade
- Real Estate
- Renting
- Business Activities
However, the fastest growth was recorded 7.5% in the industry sector, followed by 7.1% in services. According to PhilStar Global, major contributor to GDP from the expenditure side were also:
- Household final consumption expenditure
- Durable equipment
- Government final consumption expenditure
Furthermore, the Socioeconomic Planning Secretary Ernesto Pernia commented to PhilStar Global that Philippines remains as one of the best performing economies in Asia with the latest economic data.
#3 GDP Growth Rate Forecast 2018
The Southeast Asia economic outlook provides a crucial overlook of regional economic changes.
The Association of Southeast Asian Nations (ASEAN) overall is seeing a stable growth in the area thanks to:
- Vital labour markets
- Active infrastructure spending
- Strong global demand
![]()
Source: www.adb.org
#4 GDP Per Capita and Growth
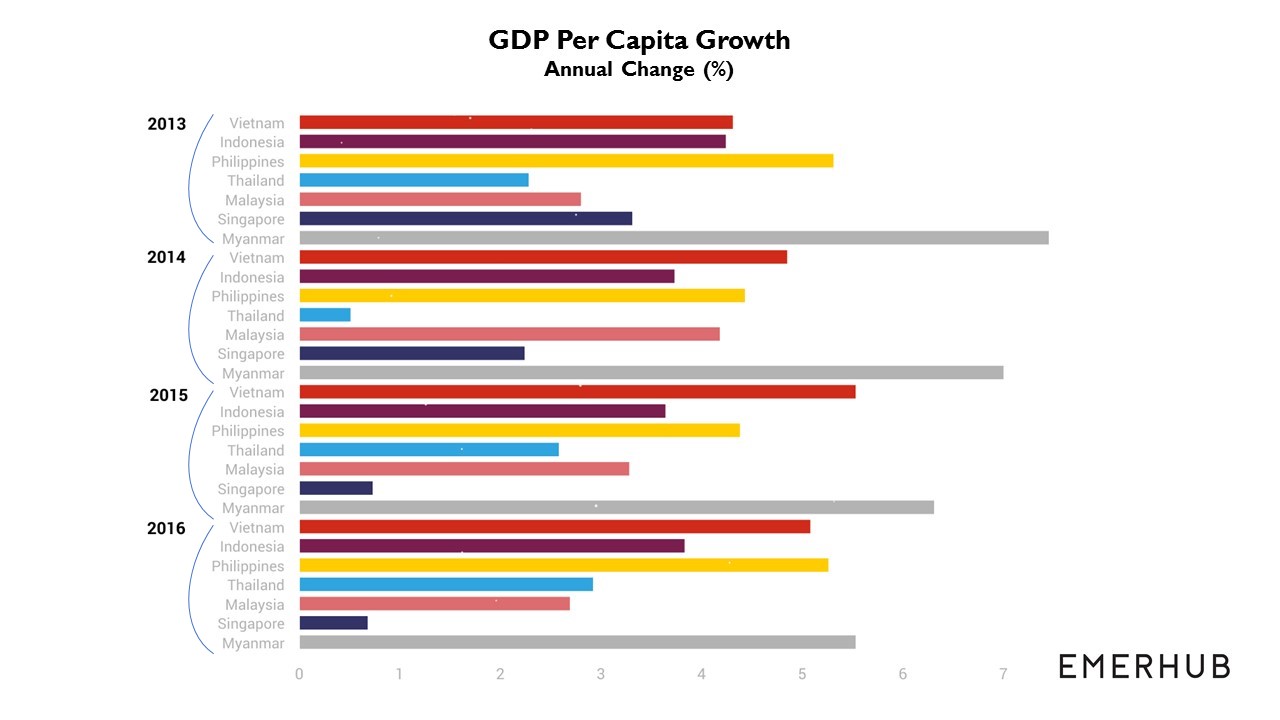 Source: www.google.com/publicdata from World Bank
In conclusion, stronger output prospects as well as GDP per capita growth in emerging markets depend on the extent to which supply-side developments improve.
Especially as to whether the investment and productivity growth is enough to outweigh demographic headwinds in some countries.
#5 Consumer Price Index and Inflation
Inflation reflects the change in the cost to the average consumer acquiring a basket of goods and services. Though these may be fixed or changed at determined intervals – monthly, quarterly, yearly. While each country’s inflation is measured by the Consumer Price Index (CPI).
|
Country |
Latest Consumer Price Index (CPI) / Index Points |
GDP Growth Rate / % |
| Myanmar |
226 / August 2016 |
5.53 |
| Vietnam |
107.41 / November 2017 |
5.08 |
| Indonesia |
130 / November 2017 |
3.83 |
| Philippines |
151 / November 2017 |
5.26 |
|
Cambodia |
169 / March 2017 |
5.22 |
| Malaysia |
120 / October 2017 |
2.69 |
| Thailand |
101 / November 2017 |
2.92 |
|
Singapore |
99.27 / October 2017 |
0.68 |
Sources: Trading Economics, www.google.com/publicdata from World Bank
![]()
Source: Asian Development Bank: Asian Development Outlook 2017 Update
According to Forbes, what is driving up the prices in Myanmar is investment with an increase in money supply for credit to private business. Another source of pressure is an inadequate supply of rice as a result of flooding, especially impacting the country’s poor.
For Vietnam, 2017 was a good year in terms of exceeding the National Assembly’s economic growth target and overall controlling the inflation. Average CPI in 2017 rose by 3.53% against 2016. Looking at the inflation forecast, main pressure article this year will be adjusting the prices of food as well as public services. Further inflationary pressure may occur due to Electricity of Vietnam (EVM) adjusting the average electricity retail price from 3%-5%, on objective price fluctuations.
See how inflation has changed in the countries under discussion in the recent years:
[iframe width=”100%” height=”325″ frameborder=”0″ scrolling=”no” marginheight=”0″ marginwidth=”0″ src=”https://www.google.com/publicdata/embed?ds=d5bncppjof8f9_&ctype=l&strail=false&bcs=d&nselm=h&met_y=ny_gdp_defl_kd_zg&fdim_y=inflation_type:1&scale_y=lin&ind_y=false&rdim=region&idim=country:IDN:VNM:SGP:PHL:MYS:THA:MMR&ifdim=region&tstart=756144000000&tend=1481990400000&hl=en_US&dl=en&ind=false&xMax=-78.84445062499992&xMin=20.823518125000078&yMax=-46.612215914352305&yMin=52.220622466601796&mapType=t&icfg&iconSize=0.5″]
Inflation is fairly low and only to consider some reasons why:
- Import prices
- Expectations of the public
- Capacity pressures in the domestic economy
Inflation in import is dictated by the balance of supply and demand in globally traded goods (e.g. commodities). Public expectations come in terms of businesses being eager to increase their prices and employees looking for higher salaries when they predict the rise of inflation.
#6 International Rating Outlook Comparison
Many emerging markets see 2017 as a year of a breakthrough with the improving economic status. With this in mind, Fitch Ratings has reviewed and upgraded the sovereign credit ratings.
| Country | Previous Investment Grade | Investment grade in 2017 |
| Philippines | BBB- | BBB |
| Indonesia | BBB- | BBB |
Source: Fitch Ratings, Reuters, Wikipedia: List of Countries by Credit Rating
Cyprus and Serbia have also earned an upgrade, however with a BB grade are left ranking lower on the scale than Indonesia and the Philippines. Yet the Philippines’ shift from BBB- to BBB is proving the country’s outlook is stable. Though when seeing and comparing other upgrades around the globe, Portugal and Bulgaria are now credited for the same investment grade.
Fitch is expecting the deficits in the Philippines to be manageable at less than a -0.5% of GDP. While key drivers of the deficit remain strong imports of capital goods associated with government’s public infrastructure programme. It is expected that foreign direct investment inflows continue to fully cover the current account deficit, also limiting the increase in external indebtedness.
Another remarkable change is seen in Indonesia. Country also moved from BBB- to BBB. Luky Alfirman, head of Finance Ministry’s financing and risk management office, commented about Fitch upgrade in Reuters:
“This upgrade will become a good capital for Indonesia in entering 2018 to attract more foreign and domestic investment, both in real sectors and portfolio.”
Though Fitch does point out some sensitivities, highlights that Indonesia’s External Finance have become more resilient to potential external vulnerabilities. All this as a result of:
- The focus of the government’s policy framework on macroeconomic stability
- The improvement in external buffers (including foreign-exchange reserves)
#7 Population and Growth
According to Worldometres, South-East Asia’s population is equivalent to 8.59% of the world’s population. Furthermore, out of the 48.7 % of the population in SE Asia being urban, the median age is 28.8.
Have a look at the yearly change of the population growth rate:
[iframe width=”100%” height=”325″ frameborder=”0″ scrolling=”no” marginheight=”0″ marginwidth=”0″ src=”https://www.google.com/publicdata/embed?ds=d5bncppjof8f9_&ctype=l&strail=false&bcs=d&nselm=h&met_y=sp_pop_grow&scale_y=lin&ind_y=false&rdim=region&idim=country:IDN:VNM:SGP:PHL:MYS:THA:MMR&ifdim=region&tstart=756144000000&tend=1481990400000&hl=en_US&dl=en&ind=false&xMax=-78.84445062499992&xMin=20.823518125000078&yMax=-46.612215914352305&yMin=52.220622466601796&mapType=t&icfg&iconSize=0.5″]
Though a growing middle class is known as a sign of good economy. However, consumption capacity and wealth of the middle class in developing countries also carry an impact. With a median age of 29, the ASEAN nation is young and makes an attractive market. Hence according to Nielsen, people with disposable income of $US 16 – $US 100 per day is expected to reach 400 million by 2020.
Customer Behaviour in Southeast Asia
HKTDC Research was carried out in the second half of 2017 to further investigate the ASEAN customer behaviour. Here is what the results show:
|
Jakarta |
Bangkok | Kuala Lumpur | Ho Chi Minh City | Manila | Hanoi |
Surabaya |
|
| Fashion |
75.5 |
150.5 | 150.5 | 150.5 | 150.5 | 75.5 |
75.5 |
| Consumer Electronics |
150.5 |
250.5 | 400.5 | 150.5 | 400.5 | 150.5 |
75.5 |
| Home & Living |
150.5 |
400.5 | 250.5 | 250.5 | 250.5 | 400.5 |
150.5 |
| Entertainment |
75.5 |
150.5 | 150.5 | 150.5 | 150.5 | 75.5 | 75.5 |
| Health, Beauty & Wellness | 75.5 | 250.5 | 250.5 | 150.5 | 150.5 | 75.5 |
75.5 |
| Cuisine, Food & Catering |
75.5 |
150.5 | 150.5 | 150.5 | 150.5 | 75.5 |
75.5 |
| Financial Services |
150.5 |
600.5 | 400.5 | 250.5 | 400.5 | 150.5 |
150.5 |
| Education |
150.5 |
400.5 | 400.5 | 150.5 | 600.5 | 150.5 |
150.5 |
| Travel & Leisure |
250.5 |
400.5 | 850.5 | 250.5 | 600.5 | 150.5 |
250.5 |
Source: HKTDC Research
Therefore, seeing the comparison of areas, there is huge potential on the market. Although it is crucial for a retailer and a manufacturer of consumer packaged goods to learn how to engage, influence and fully entertain a customer. Furthermore, technology becomes more and more accessible to the markets and brand loyalty needs to be both earned and fought for.
#8 Consumer Confidence Index
![]()
While observing the Mastercard Index of Consumer Confidence Data, many of the emerging markets show progress when comparing the index with last half year’s result.
While asking over 9153 respondents to give a 6-month outlook on five economic factors, Indonesia, Philippines and Vietnam remained stable. Though the greatest improvement was recorded in Singapore and Malaysia.
|
H1 2017 Current Status |
Change from last half |
|||
| Asia Pacific |
66.9 |
Optimistic | 4.2 |
Stable + |
|
Korea |
78.0 | Very Optimistic | 46.7 |
Extreme Improvement |
| Singapore |
45.4 |
Neutral – | 15.4 |
Significant Improvement |
| Malaysia |
42.3 |
Neutral – | 11.1 |
Significant Improvement |
| China |
88.2 |
Very Optimistic | 7.4 | Some Improvement |
|
Bangladesh |
89.4 | Very Optimistic | 6.6 |
Some Improvement |
| Hong Kong |
47.0 |
Neutral – | 4.8 |
Stable + |
| Taiwan |
38.3 |
Pessimistic | 4.1 |
Stable + |
| Indonesia |
74.8 |
Optimistic | 4.0 |
Stable + |
| Australia |
49.2 |
Neutral – | 2.7 |
Stable + |
| Japan |
44.4 |
Neutral – | 1.4 |
Stable + |
| Cambodia |
93.1 |
Extremely Optimistic | -0.7 |
Stable – |
| Vietnam |
90.8 |
Extremely Optimistic | -1.5 |
Stable – |
| New Zealand |
60.5 |
Optimistic | -1.7 |
Stable – |
| Sri Lanka |
38.2 |
Pessimistic | -2.0 |
Stable – |
| Philippines |
88.8 |
Very Optimistic | -2.7 |
Stable – |
| Thailand |
63.9 |
Optimistic | -4.4 |
Stable – |
| Myanmar |
86.8 |
Very Optimistic | -6.0 |
Some Deterioration |
| India |
86.0 |
Very Optimistic | -9.3 |
Some Deterioration |
Choosing Consumer Markets
As it turns out, the volume may be deceitful – the busiest areas may not be the busiest for your business. Moreover, according to Nielsen and AlphaBeta research, lower density regions are leading consumer growth in ASEAN. And this for up to 2030.
Furthermore, the report emphasized the importance of capital cities, such as Manila, Jakarta and Bangkok. However it noted that these cities will not drive or dominate the demand amongst ASEAN consumers. Though according to the report the “middleweight regions” (population between 500,000 to 5000 000) will likely face the fastest growth in consumer markets to 2030.
According to SGSME, Nielsen Growth Markets group president Patrick Dodd has said that companies should develop individual products. He highlighted the importance of doing it on a micro-regional basis, also taking each region’s market conditions into consideration.
“While Asean has been enjoying economic recognition in recent years, businesses tend to view it as a single entity and surprisingly, little is known about the many cities and regions that make up the archipelago. It’s time for companies to look beyond mega-cities to see the growth opportunity hotspots within middleweight regions.”
ASEAN Millennial Consumers
Consumer confidence in ASEAN countries is led by youth. Hence as it appears from the Mastercard Index of Consumer Confidence, the millennials in the area (18-29 y.o.) are feeling optimistic about the upcoming six months. Older consumers though are considerably more reserved. As when approaching the Generation X, the ones aged 30 and above, the score was lower.
The consumer confidence is in correlation with an economy’s development. Though based on the current results, the millennials in Malaysia appear the most pessimistic on the confidence scale. However, Vietnam’s millennial consumers are showing an optimistic result with 93.2 points. To close with a positive note, the Cambodian millennials are the most optimistic ones in numbers, scoring 95.4.
Emerhub will be your key contact when entering the market. Reach out to us for further advice in Indonesia, Vietnam and the Philippines.


